The global market for knowledge management is projected to reach a whopping size of US$1.1 Trillion by 2026, up from US$381.5 Billion in the year 2020.
The success or failure of today’s customer service predominantly hinges on knowledge management. Picture this: when a customer hits a snag with one of your products or service, contacting a service agent would be the last option on their list. A self-help knowledge base article is preferred above all.
But when self-service fails, they turn to a service agent who can conjure a magical solution out of their hat. Trouble comes knocking when the KM system traps the service mavens in an ocean of data as they attempt to find a relevant solution.
That is where KCS emerges as a ray of sunshine. The methodology has been revolutionizing KM initiatives by thwarting escalations and mitigating the avalanche of today’s digital challenges—poor content findability, lack of knowledge creation, silo mentality, and so on—in one fell swoop.
However, after the initial kick-off, the excitement around KCS programs comes to a grinding halt. Consequently, it becomes an uphill battle to keep the progress curve going up. Well, fret not; with real-time analytics, you can see that curve skyrocket.
In this blog post, we will talk about all the analytical reports that help ring up the curtain to top-notch KM and unlock customer service success for good. Let’s get cracking!
Climbing the Stairway to KM Success with Real-time KCS Insights
Real-time KCS analytics have become vita in the knowledge management landscape. In the world of breakneck speed, guessing games based on historical events do not work. Forward-thinking enterprises bank on data-driven insights—content gap reports, self-service metrics, conversion ratio, bounce rates, etc.—to uncover hidden patterns and make informed decisions.
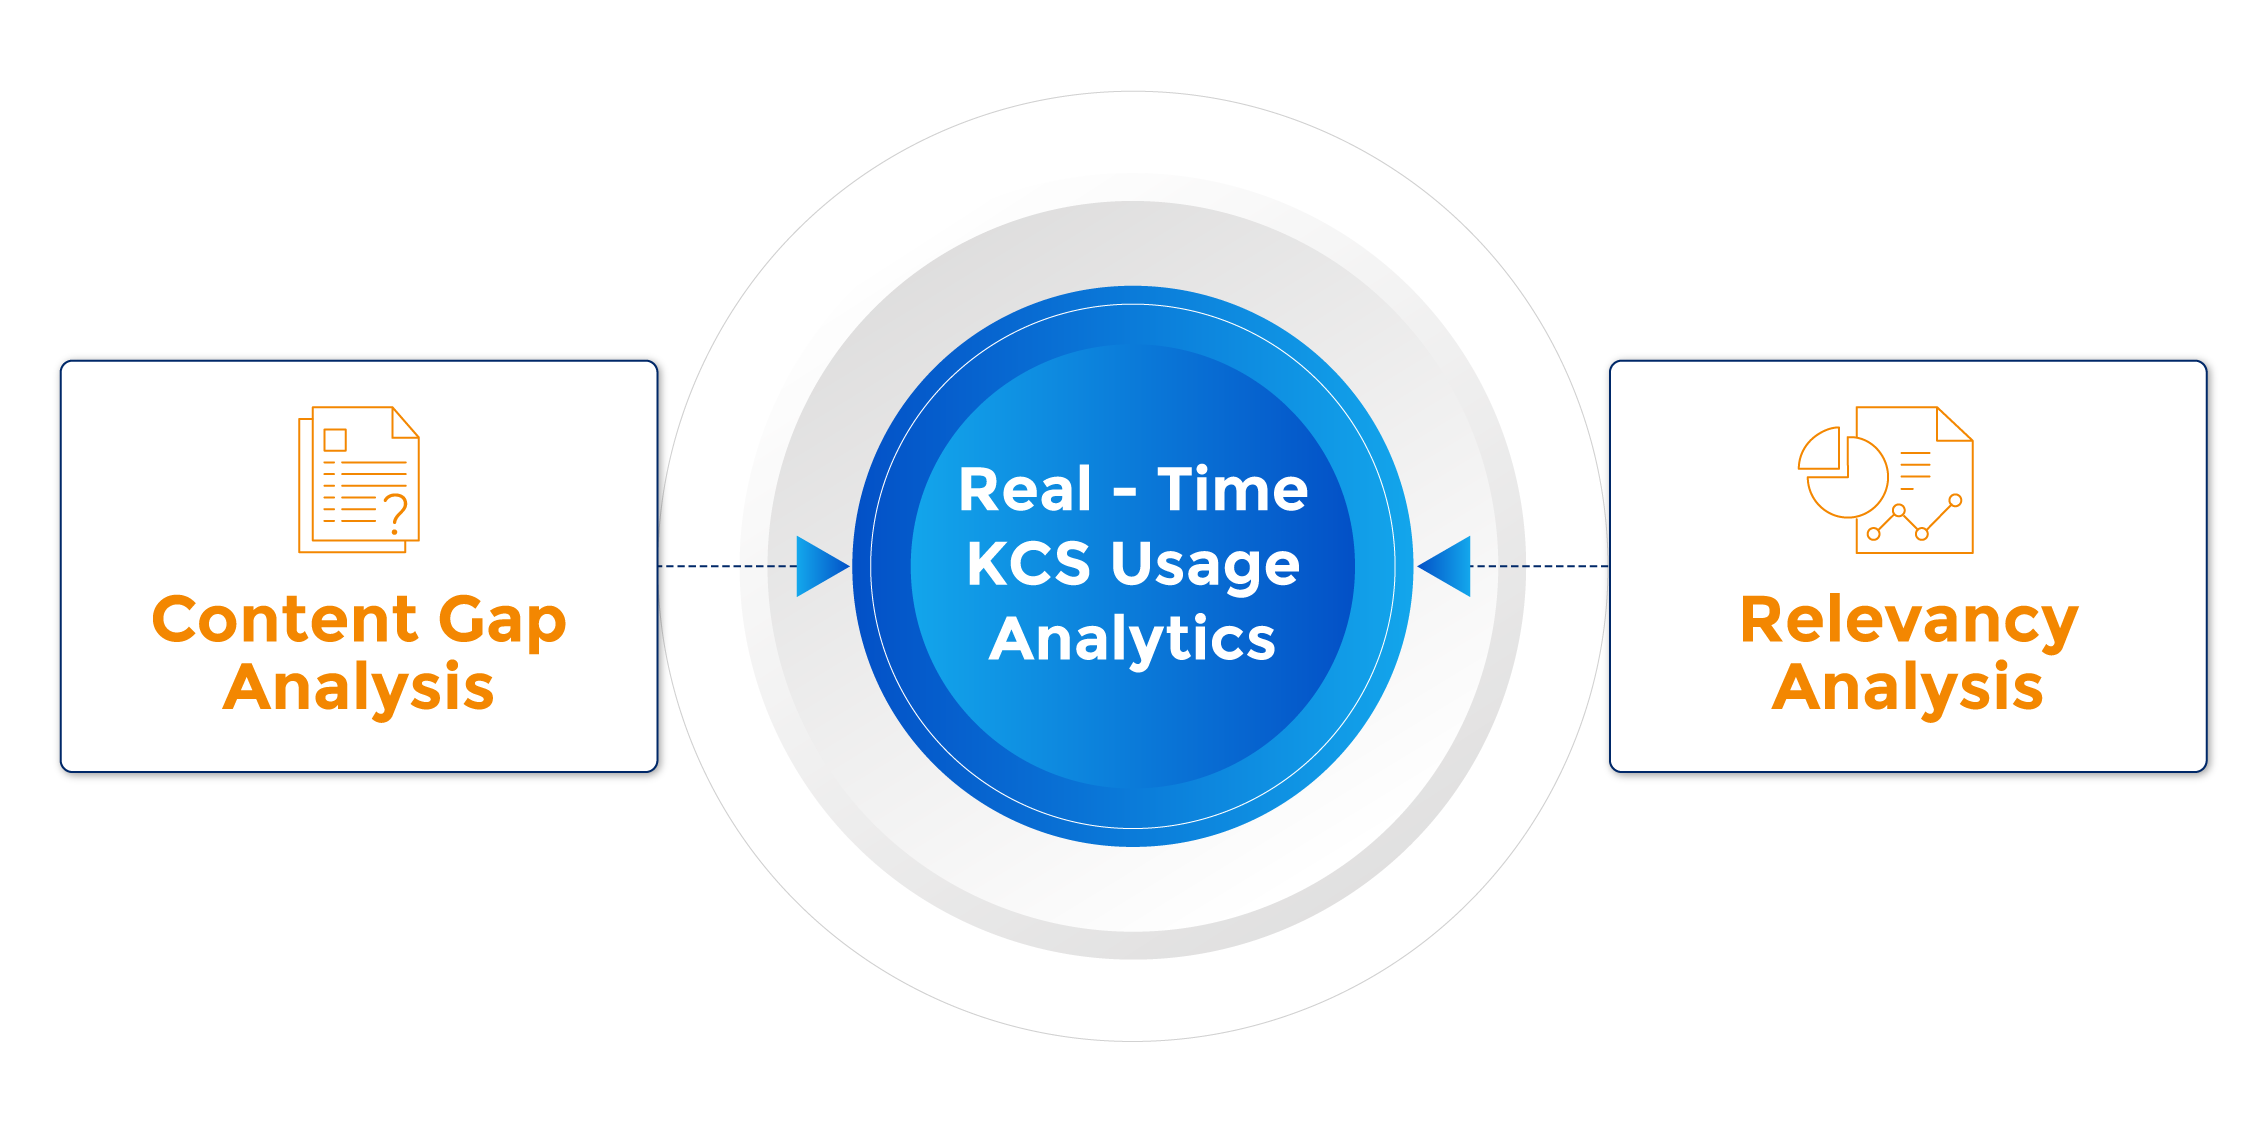
At SearchUnify, we look at two broad categories of real-time analysis:
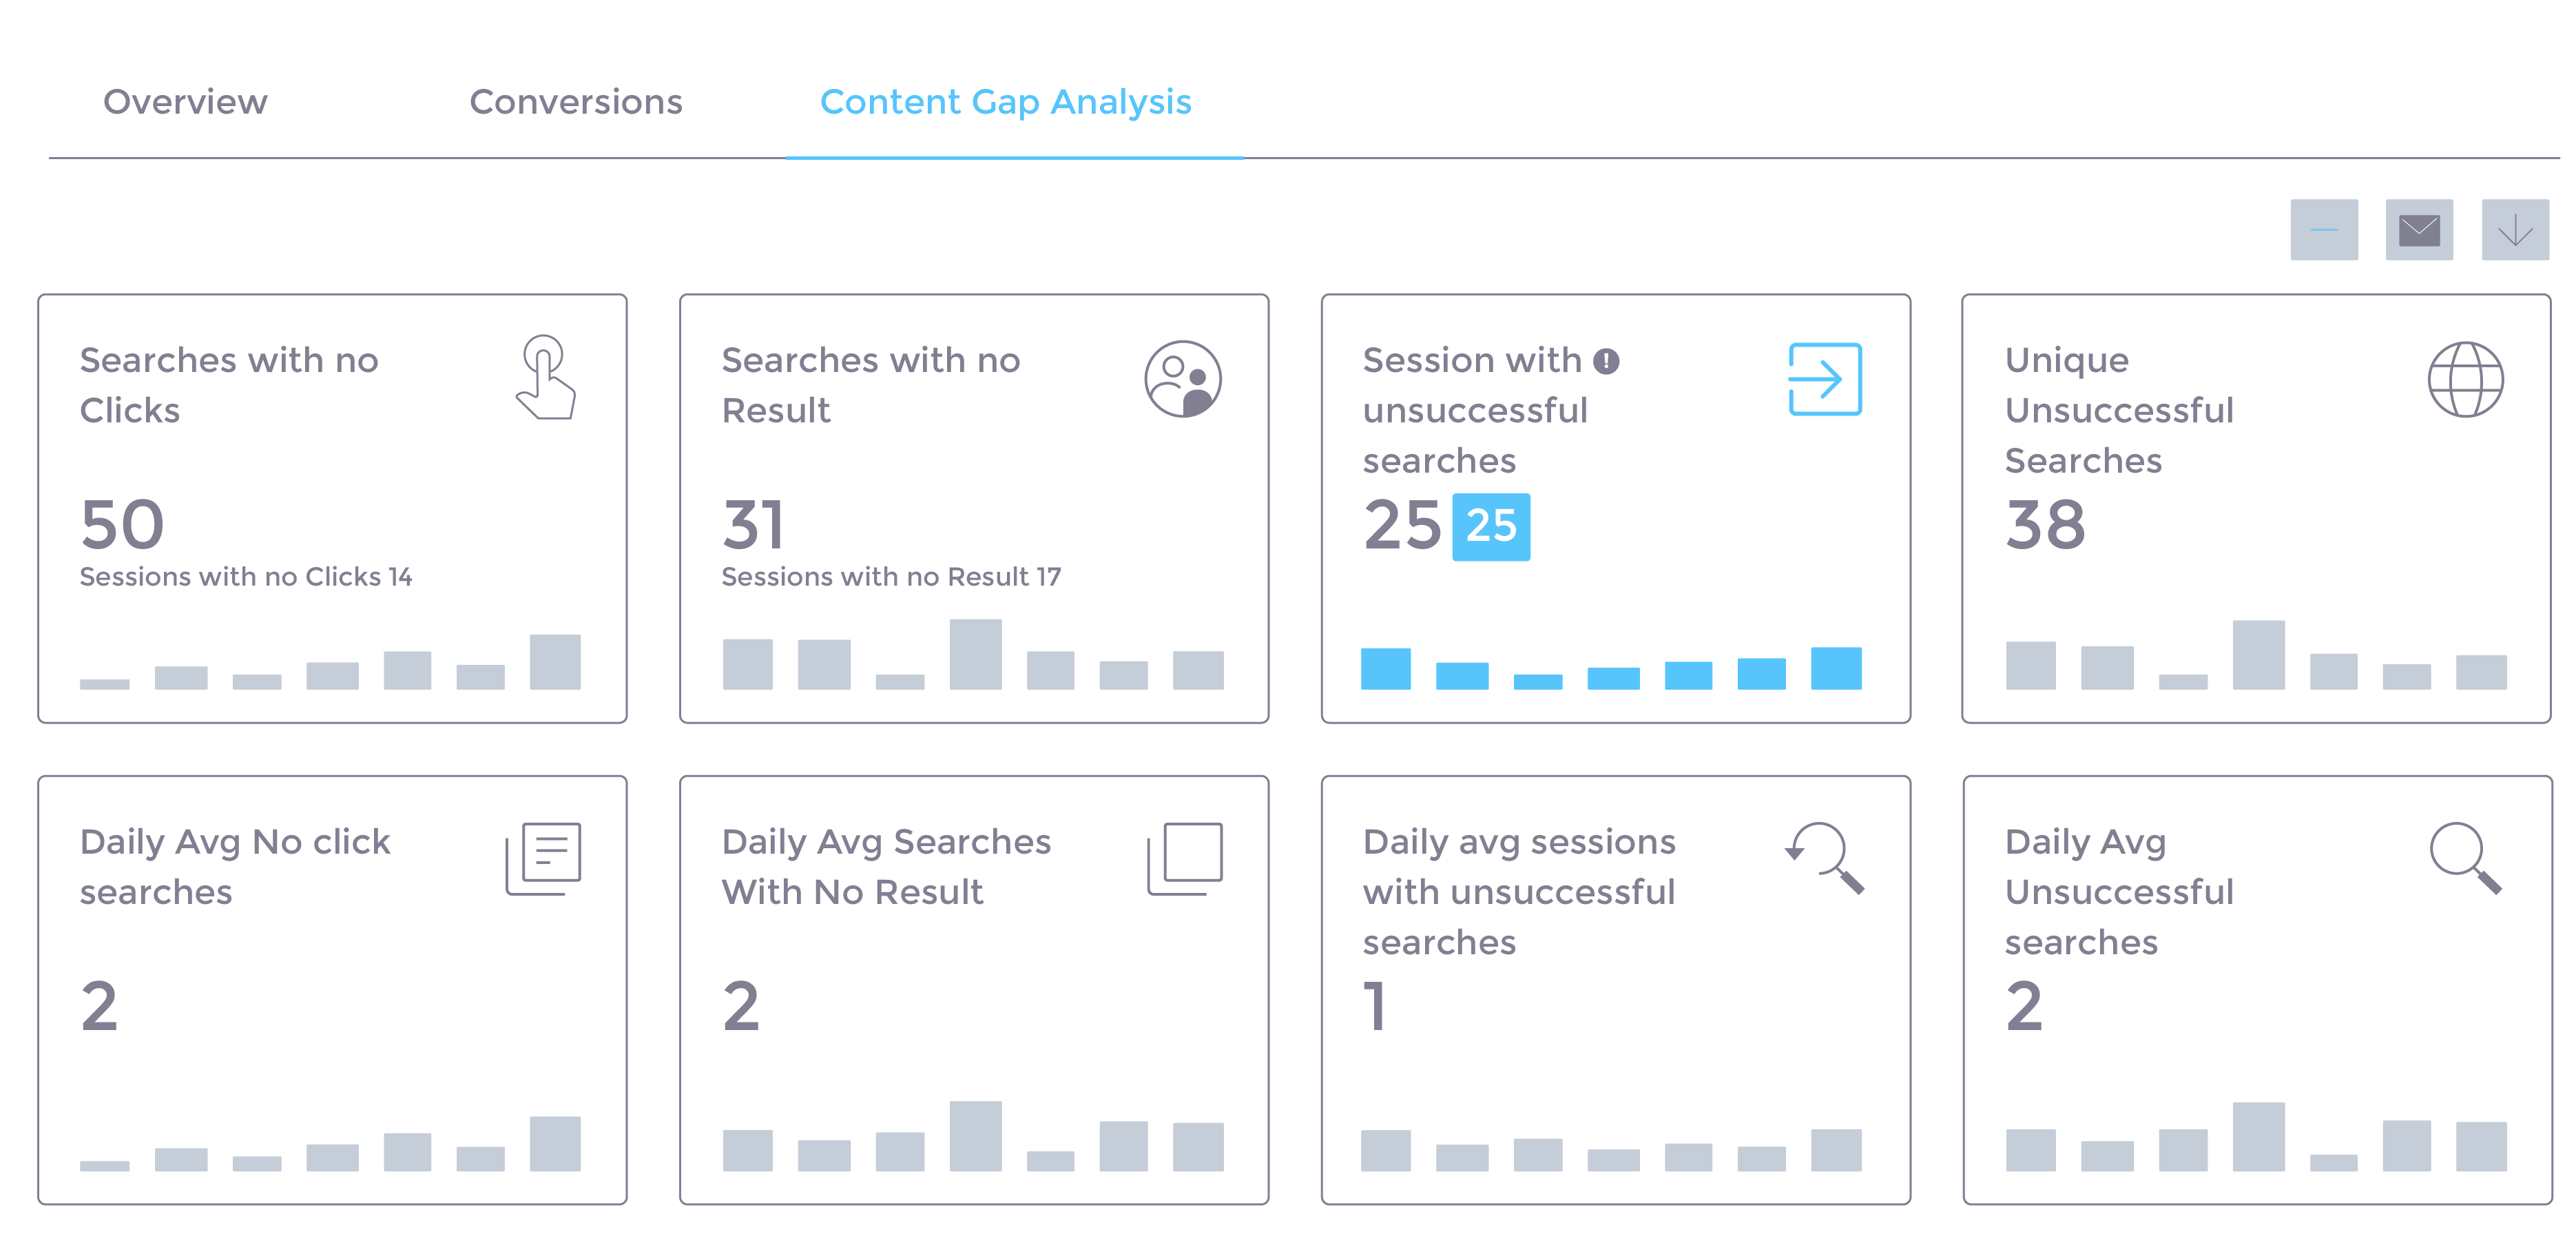
1. Content Gap Analysis
Most of the time, there are gaps between the existing content and the content your visitors want to see. A comprehensive content gap analysis report can help you uncover them. Next-gen cognitive platforms arm organizations with granular reports on Searches with No Clicks, Searches with No Result, Sessions with Unsuccessful Searches, Unique Unsuccessful Searches, Daily Average No Click Searches, Daily Average Searches with No Results, Daily Average Sessions with Unsuccessful Searches, and Daily Average Unsuccessful Searches.
2. Relevancy Analysis
What good is a search if the results are not relevant to you? Let me run you through a hypothetical scenario: a community member is looking for information related to ‘Intellectual Property’ but only sees results related to ‘Internet Protocol.’ Won’t they assume that the site doesn’t offer the information they seek? Affirmative, right?
This is where relevancy metrics come to the rescue. They include reports such as Successful and Unsuccessful Deflections, Click Position, High Conversion Results Not on Page One, and so on.
Compendium of Analytical Reports to Keep a Laser-Focus on for Scaling KM Initiatives
Analytical reports act as a vehicle that helps brands achieve an effective knowledge management system. Let’s take a closer look at what these reports bring to the table.
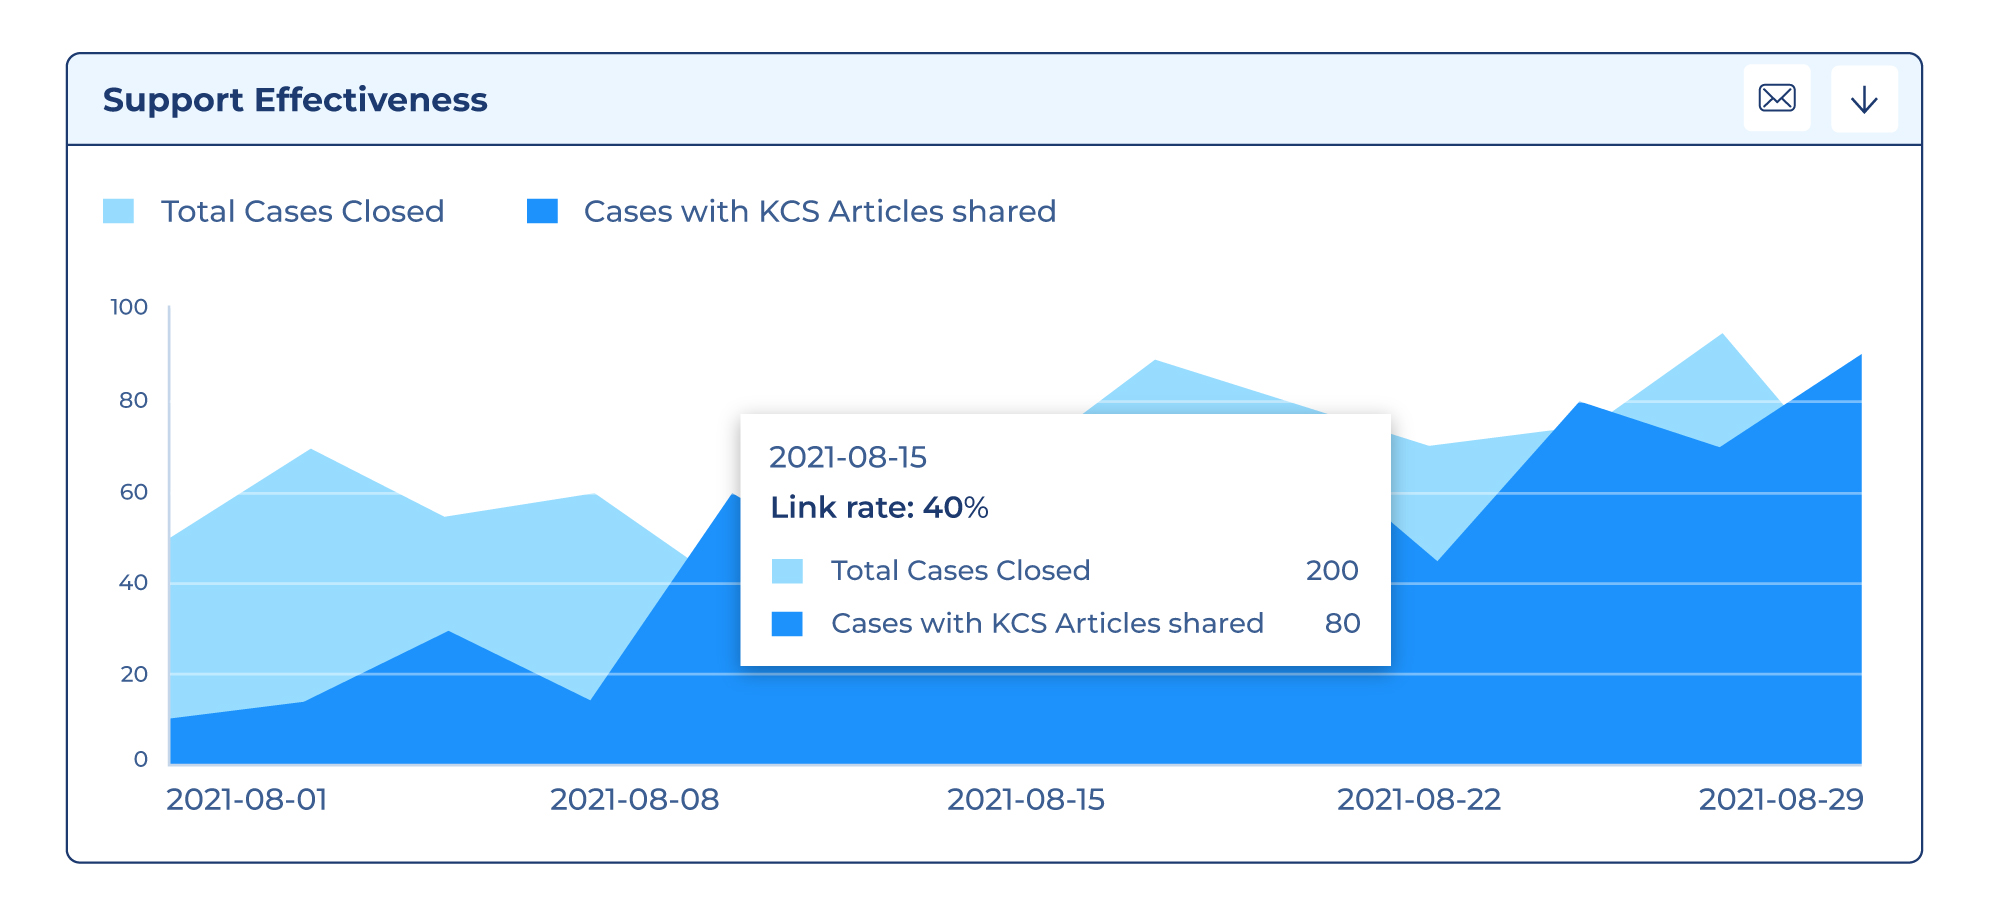
1. Support Effectiveness
It is a stacked area graph that keeps you on top of two crucial metrics; the total number of cases closed and the contribution of KCS-generated content in closing them. This way, you can gauge the impact of your KCS program w.r.t support outcomes. Nifty, right?
2. KCS Contributor Analytics
This report helps you identify the knowledge workers who create the most articles and the impact of their work on case resolution. In other words, it highlights your KCS MVPs. They, in turn, can guide other employees to better contribute to the KCS initiative.
3. KCS Articles Usage Analytics
This metric is used to quantify the impact of KCS on your support team’s efficiency. Later, this impact, often measured in terms of article shares, can be converted into hours of effort and dollars saved.
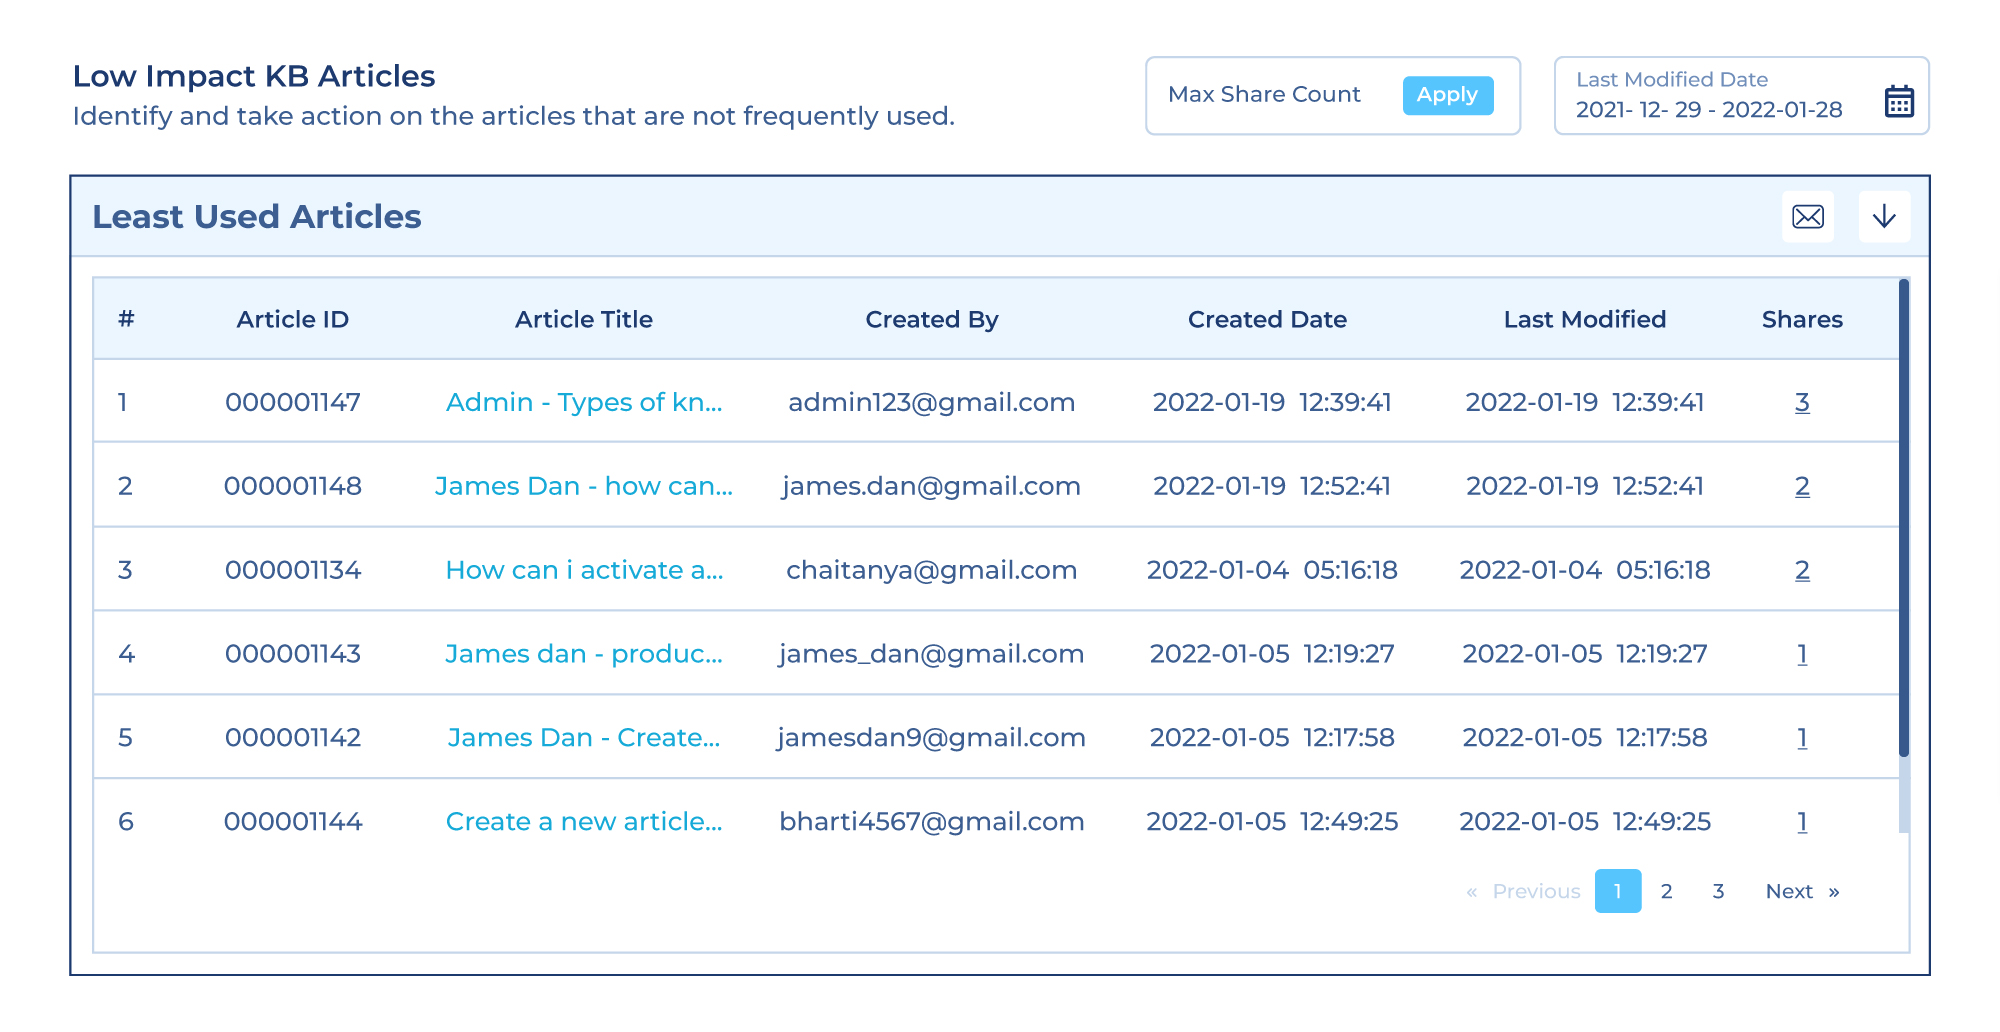
4. Low Impact KB Articles
It is measured to discover articles having little impact on case resolution. Once identified, you can analyze them to zero-in on the reasons behind the lackluster performance and work on improving them.
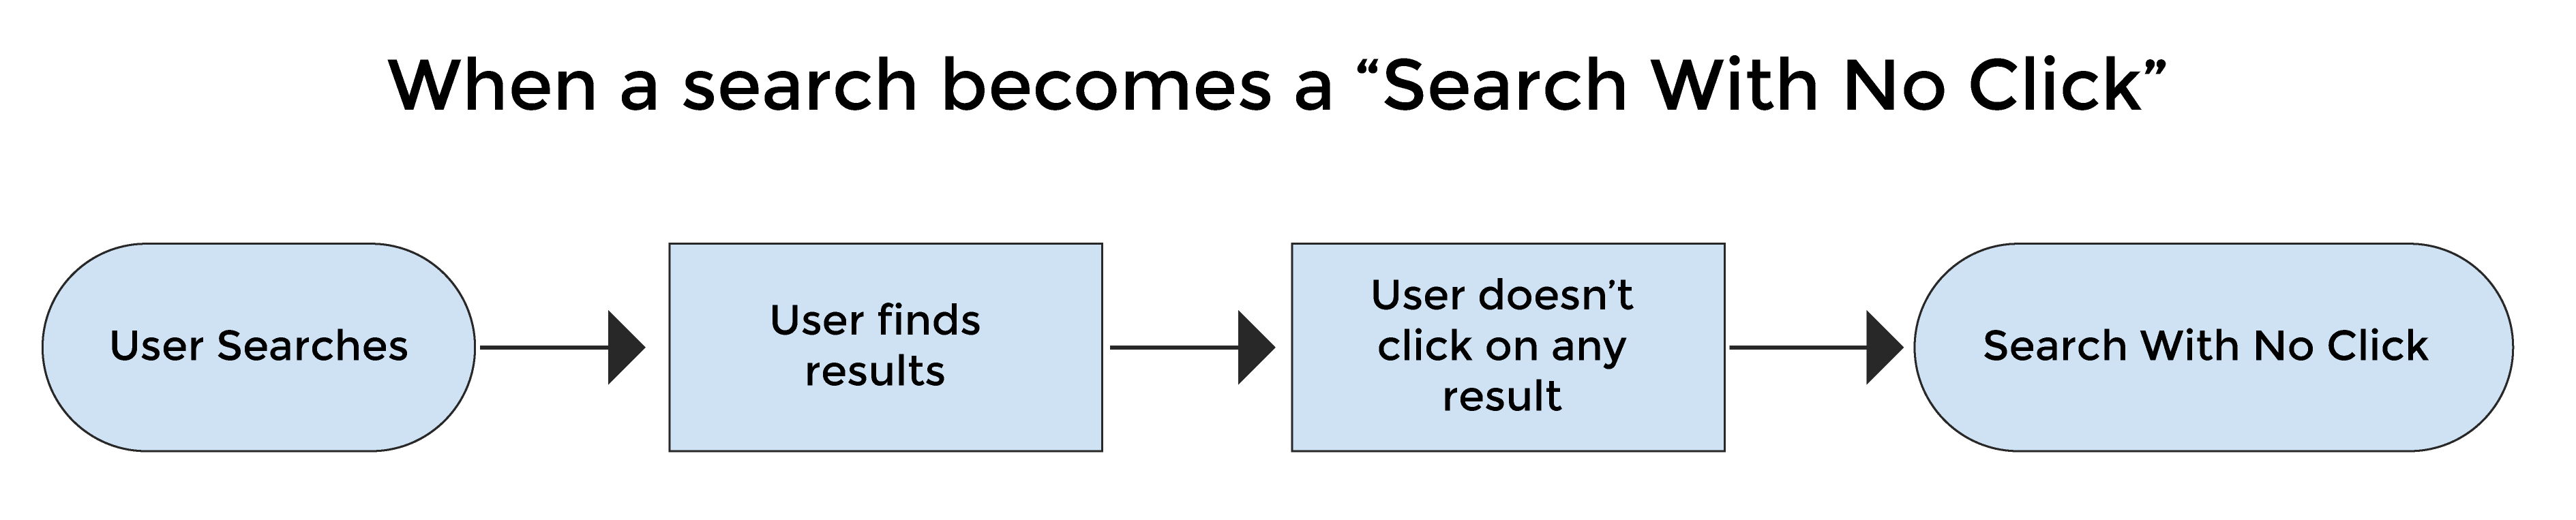
5. Searches with No Clicks
This report helps you evaluate how many users find the results in response to a search query but don’t click as it might not be what they expected. If this number is high, it is time to refurbish your KBs.
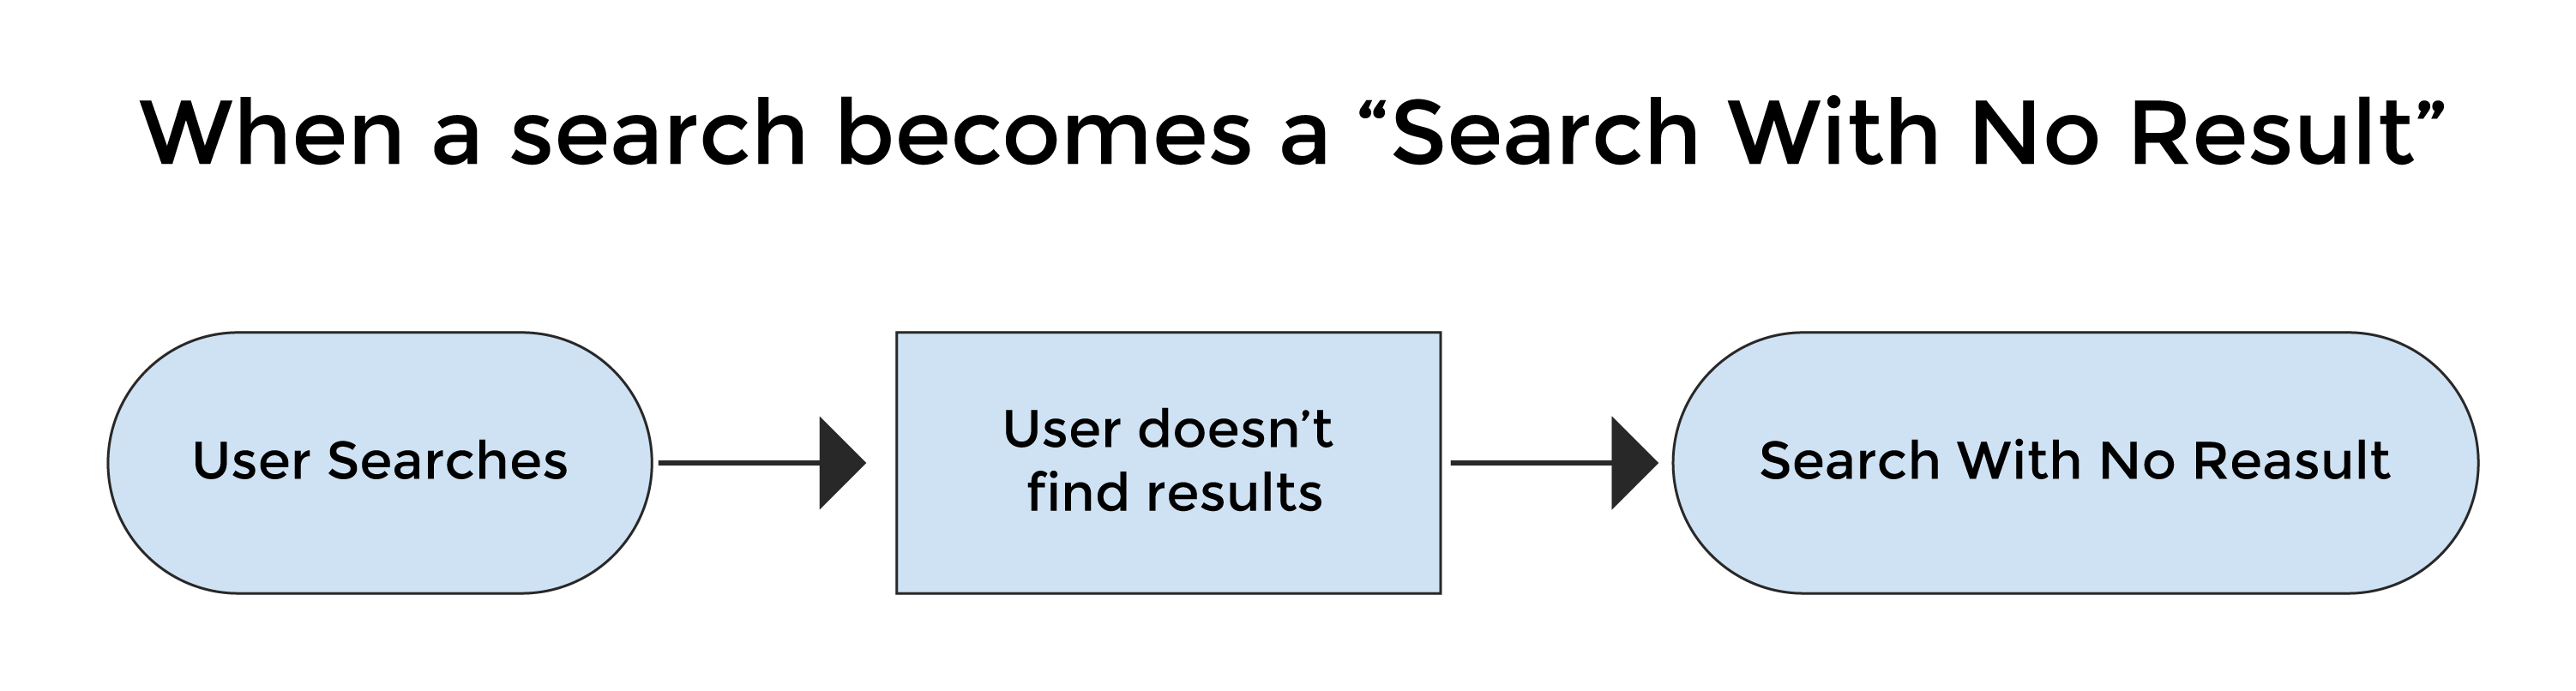
6. Searches with No Results
It is measured to understand the total number of searches for which no result was found. Based on this metric, the service managers can identify and close any content gaps.
7. Successful Case Deflection
Successful Case Deflection captures the star performers in your documentation: the articles consulted by a user who never logged a ticket.
8. Unsuccessful Case Deflection
On the flip side, this report captures the weakest links in your documentation: the articles and sessions that were consulted on the home page or the case creation page.
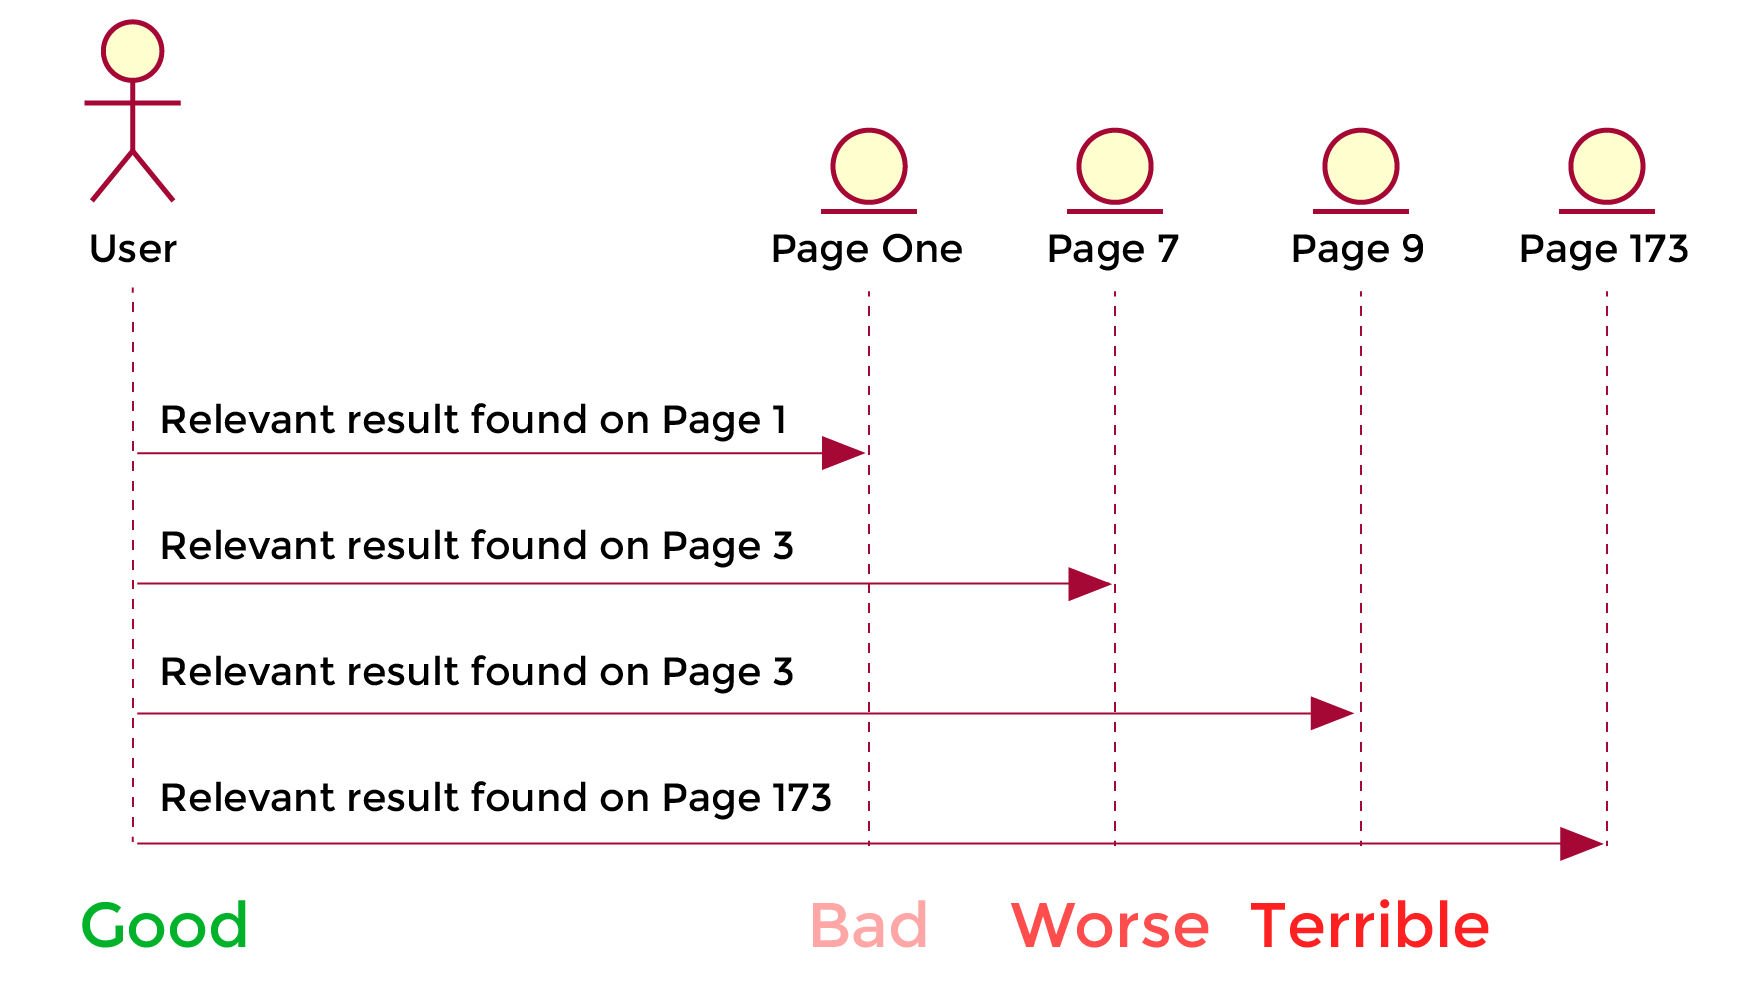
9. Average Click Position
It is a cornerstone metric for measuring the overall effectiveness of your search results by tracking where your users are clicking on the SERPs. A search engine brings back billions of results in a jiffy, but if the users have to navigate to page no. 5, 7, or, 9 (as shown in the image below) to find the intended content, your search is underperforming.
10. Session Tracking
It tracks how much your content resonates with your target audience by illustrating how long visitors stay on your site. Longer sessions indicate more engaged visits. However, it is most helpful when looked at with other engagement metrics.
Average Session Duration = Total Session Duration/Total Number of Sessions
11. High Conversion Results Not on Page One
As the name suggests, it highlights the frequently-clicked results that are not surfacing on the first page.
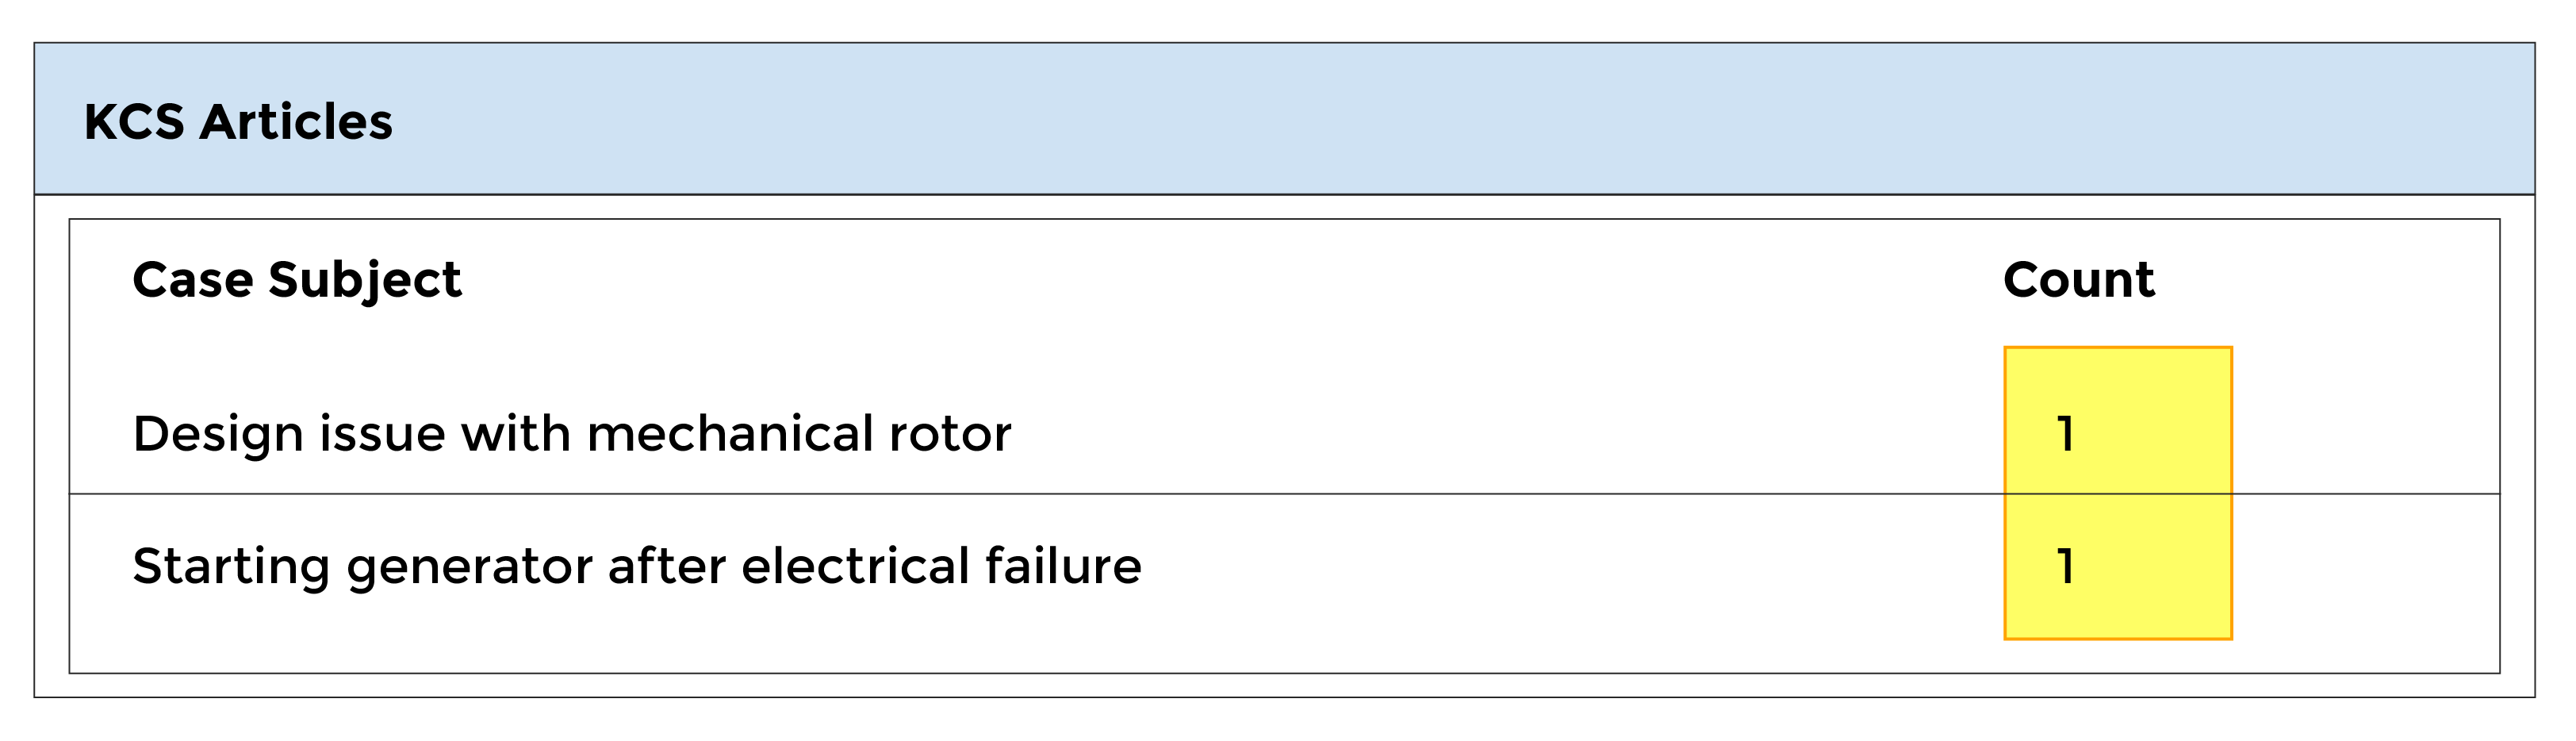
12. KCS Article Report
This report helps you measure how many articles have been created against a particular case subject. It has two columns: Case Subject and Count. The ‘case subject’ lists the cases in which the articles have been created while ‘count’ captures the number of articles created in a particular case.
Wrapping Up
The ultimate goal of measuring all these metrics is to empower your organization with a crystal clear picture of what your customers think about your products and services. Based on the findings, you can weave strategies that make their experiences even better by plugging the knowledge gaps. All this increases customer satisfaction, lowers operating costs, and catapults seamless customer service.
Need More Help? Tune into This Webinar to Conquer KM Woes Expeditiously!
We hosted an edifying webinar where Vyjayanthi Sreenivasan, Sr. Manager at Automation Anywhere and a KCS-certified practitioner, and Divanshi Arora, Sr. CSM, SearchUnify, revealed some of the best practices to conquer the KM woes with KCS. Check it out right here.
You never know what serendipity has in store for you! 🙂