57% of today’s customers prefer to engage companies through digital customer service channels.
Back in the day, when people needed to fix something, they would simply pick up the phone and connect with a service professional for help. A lot has changed. They no longer call your support representatives as the first step. They prefer self-service channels such as a website, community, virtual assistants, or voice response system.
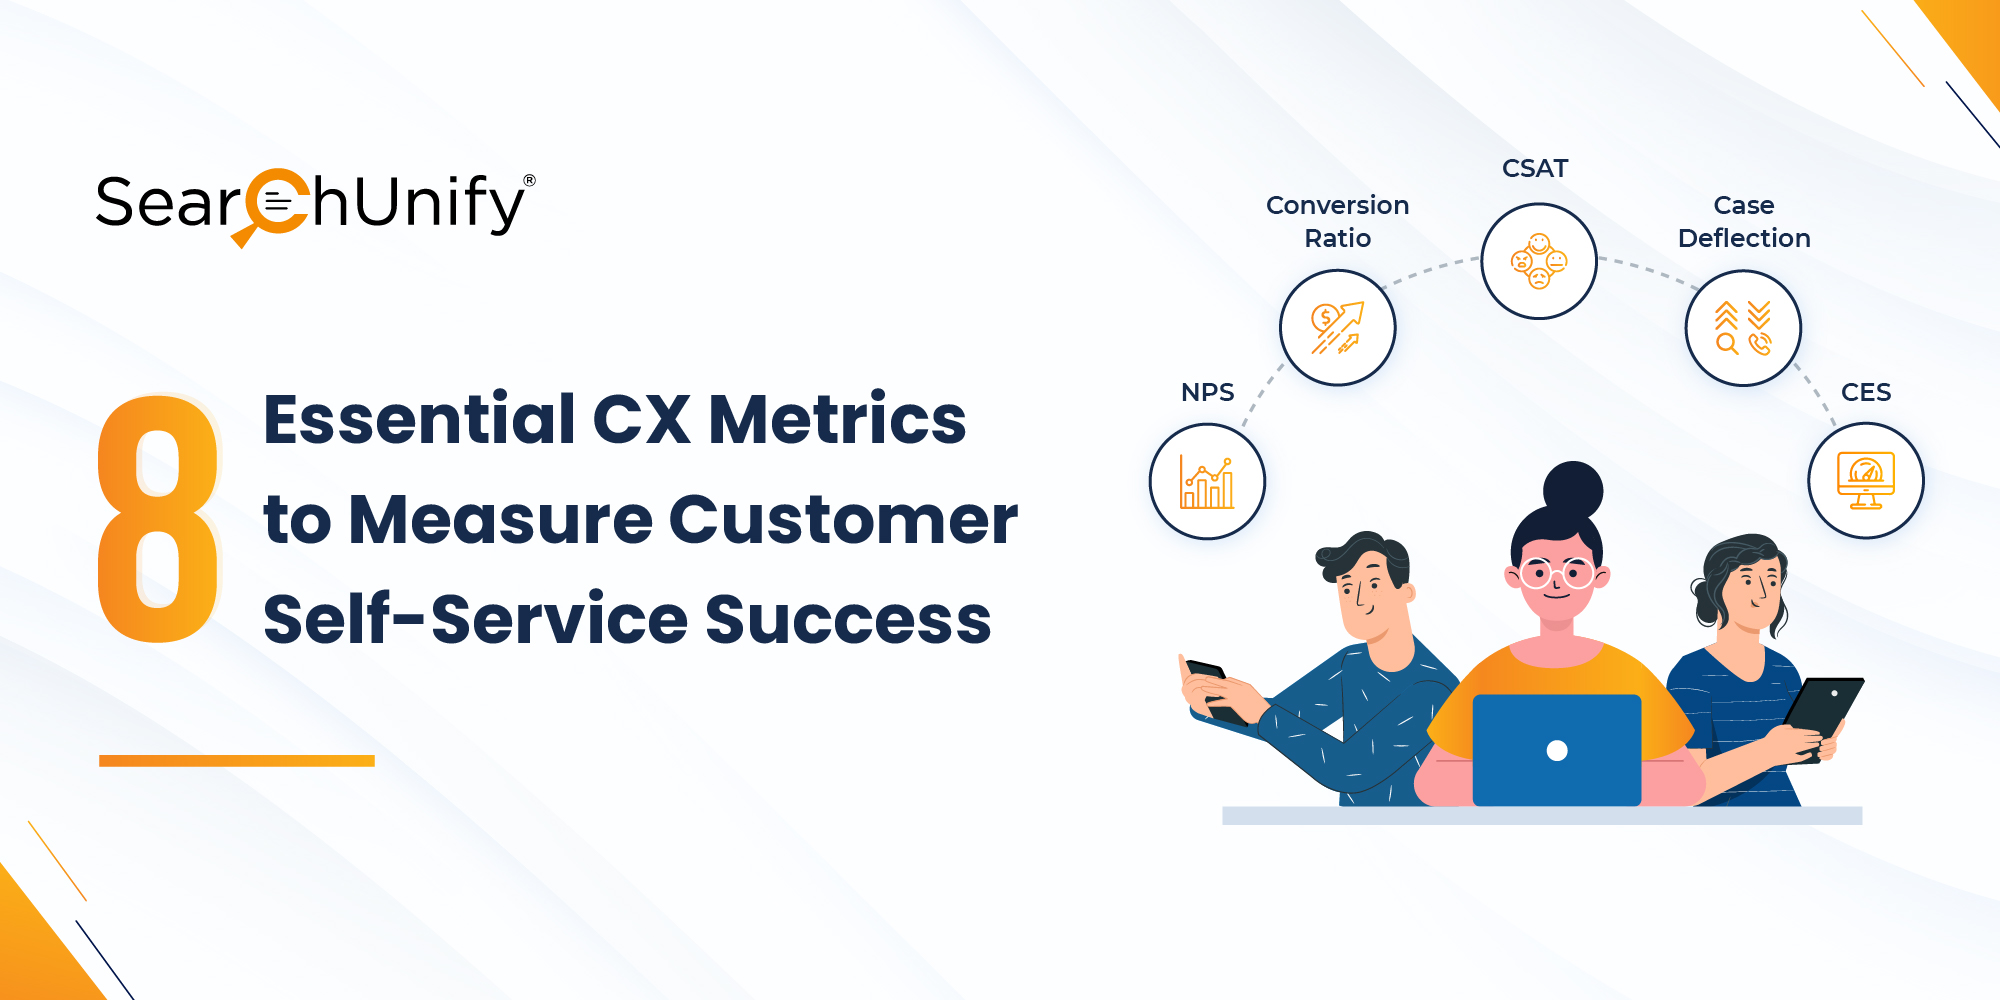
Hence, it’s safe to say self-service has come a long way. Therefore, the way your company measures it also needs to evolve. This blog focuses on the user experience metrics that are crucial to measuring self-service success. After all, “the customer is always right.” So, let’s get the ball rolling in the right direction.
Customer Experience Metrics to Measure Self-Service Success
1. Net Promoter Score
86% of consumers will leave a brand they trusted after only two poor customer experiences. This is a clear indication that even a single experience can make or break your customer’s perception of your brand.
The Net Promoter Score (NPS) makes it easier to determine how your customers feel about you without hounding them with long surveys. Further, the adoption of generative AI makes it even easier, as GenAI-powered virtual assistants (VAs) often ask for feedback as soon as a conversation ends.
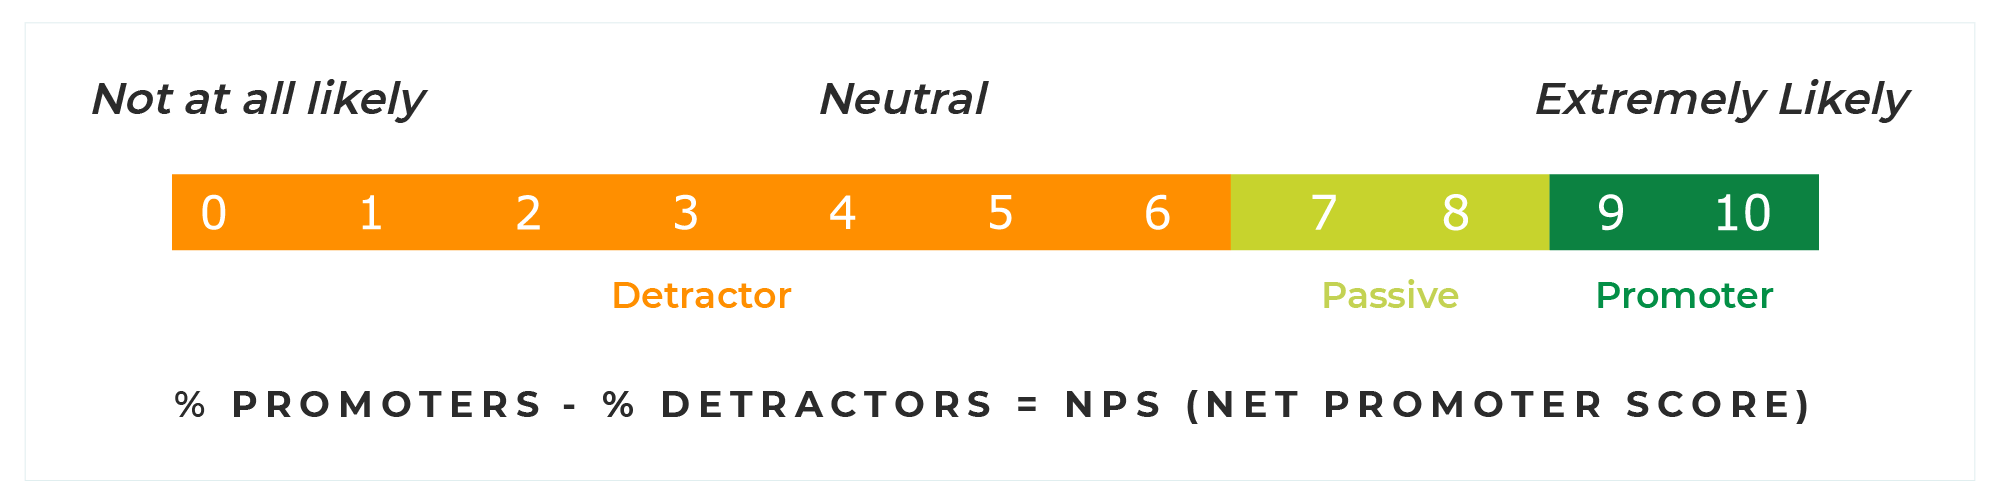
Source : www.netpromoter.com
NPS is a great CX metric, but be mindful of the ‘timing.’ Don’t bombard them with the survey after their maiden attempt. That can be very annoying. Once you observe them using your self-service portal regularly, ask them.
2. Customer Effort Score
Customer Effort Score (CES) enables brands to measure how easy it is for customers to interact with their products, services, platforms, etc. This can be measured in any of the following ways:
- Likert Scale: Customers are presented with a statement and a range of response options, typically ranging from “Strongly Disagree” to “Strongly Agree” or a similar set of gradations.
- Numerical Scale: Customers provide a numerical rating on a scale, often ranging from 1 to 10.
- Face Scale: Users select an emoticon or face that corresponds to their level of effort, usually ranging from a frowning face (indicating high effort) to a smiling face (indicating low effort).
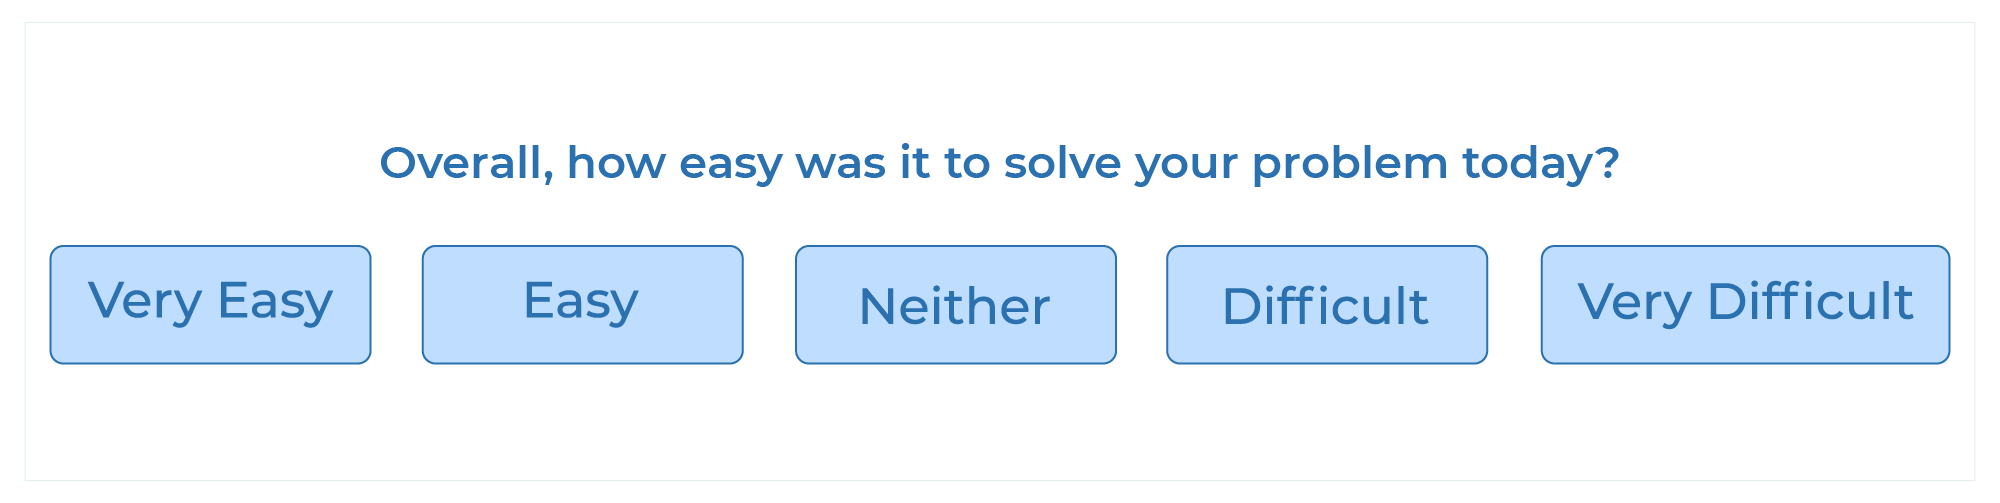
Source : www.questionpro.com
The response scale is usually 1 through 5, with 1 representing ‘Very Difficult,’ and 5 representing ‘Very Easy.’ Research leaders with CEB (now Gartner) found that around 96% of consumers that reported having difficulty while solving a problem were more disloyal.
Hence, CES surveys are a great way to approach your self-service efforts with a fine-tooth comb and gauge the overall ease of using the portal. You can send a CES survey after an interaction on your self-service channel that led to an issue resolution or once customers finish their onboarding period.
3. Conversion Rate
This refers to the number of people who “converted” by performing the action you wanted them to. For instance, if they visit the landing page for a webinar you’re hosting, the expected action would be for them to sign up for the event.
In this scenario, the landing page would indicate how well you were able to empower them for self-serving with the information provided. As such, higher conversion ratios indicate better self-service options, ultimately boosting business profitability.

4. Case Deflection
Case deflection rate is a crucial metric that gauges the percentage of customer inquiries or issues resolved through self-service options or online resources, diminishing the necessity for direct support.
A higher deflection rate means that you have successfully empowered your customers, resulting in reduced support costs and an improved overall boosted CX.
This can be calculated as follows:

5. Logged Customer Contacts
This metric is vital for assessing the effectiveness of self-service resources in meeting customer needs. It measures the percentage of customer contacts that originate from self-service interactions compared to the total number of tickets.
A high percentage of customer contacts logged indicates a potential gap in the self-help content, signaling the need for a thorough re-evaluation and enhancement of your self-service resources to better align with customer expectations and reduce reliance on direct support channels.
Regular monitoring and adjustment based on this metric contribute to an optimized support ecosystem.

6. Bounce/Abandon Rate
Bounce rate pretty much indicates how many customers are “bouncing off” your self-service channels. It is used to measure the number of visitors or customers who exit the portal after viewing only a single page, often attributed to issues such as poor content findability or irrelevant information.
High bounce rates can be pretty detrimental to businesses, indicating very low engagement, and the need to update your self-service materials.
Bounce Rate = Total no. of single-page visits/Total no. of portal visits

7. Customer Satisfaction Score
Customer Satisfaction Score (CSAT) is a crucial metric employed to gauge how satisfied your customers are with your brand as a whole. After interacting with the support team, customers are issued a concise survey prompting them to rate the assistance provided.
The CSAT Score is calculated as:

This metric provides valuable insights into the overall satisfaction levels of customers, aiding businesses in identifying areas for improvement and ensuring continual enhancement of the customer support experience.
8. Escalation Rates
This is pretty much in the same ballpark as the case deflection metric, but instead of measuring the cases you were able to resolve through self-service channels, it does the opposite.
Staying on top of escalation rates ensures that the moment they start rising, you’ll know to take proactive measures. It is calculated as follows:
Escalation Rate = No. of support tickets escalated from the first tier / Total no. of support tickets

With these measures in mind (and on your scale), get ready to witness a brand-new world of elevated self-service.
So, Where Do We Go From Here?
Technology is a large part of any game-changing business solution. And that’s why it’s time for a definitive paradigm shift in the way organizations approach self-service. The old tricks simply won’t do, and as it happens, we have got just the perfect guide for you to achieve self-service success at scale.
Want to Learn More? Download This Guide to Conquer Self-Service
At the core of a successful organization lie the strong pillars of customer experience holding everything in place. In the modern era, CX is spread across various channels and can get hard to manage.
Fret not, there are steps you can take to step up your CX game. For instance, large language models (LLMs) can perform and streamline many customer touchpoints and instantly amp up their entire journey.
Tune into our on-demand webinar to uncover industry experts’ take on revolutionizing CX for enterprise with the help of LLMs.